How scientific is the theory of man-made global warming?
By Thomas B. Fowler ( bio - articles - email ) | May 21, 2024
Along with some other major leaders and many popular pundits around the world, Pope Francis has increasingly emphasized the dangers of man-made (anthropogenic) global warming. He even seems quite frequently to make it our top spiritual priority to respond to this threat. Unfortunately, it is even more dangerous for scientific questions to be settled either politically or religiously. Rather, scientific questions must be settled using the methods proper to science.
Therefore, whenever any new scientific theory is proposed, there are several questions that need to be asked
- What causes and effects are proposed?
- Does each cause precede its effects?
- In the case of phenomena that cannot be investigated in a laboratory, what does the historical record show?
- What specific predictions does the theory make?
In the case of the ongoing climate controversy, these questions are especially relevant. According to proponents of the commonly advanced theory of global warming, human-generated emissions of carbon dioxide (CO2) are responsible for most of the warming that has occurred over the past 40 years or so, due to an increase in the greenhouse effect. The increased CO2 is claimed to cause excess warming radiation to be trapped by the Earth’s atmosphere, thus increasing Earth’s temperature. That is, the cause of the warming is increased CO2 gas, and the effect is an increase in global temperatures. The implication of the theory is that if we can reduce human emissions of CO2, we can reduce or at least stabilize global temperatures.
Before looking at questions 2 to 4 in the above list, we should note the following:
- The concentration of CO2 in the atmosphere is now about 400 parts per million, or less than ½ of 1%.
- CO2 is far from the main source of the greenhouse effect. The major component of the Earth’s greenhouse effect is water vapor (H2O), about 75%; CO2 is responsible for about 18%. No one believes that any sort of reduction of this is feasible.
- CO2 is responsible for plant growth; a concentration of CO2 below about 150 parts per million would cause a die-off of higher plants, and as a consequence, higher life forms, including us. Higher concentrations of CO2 yield more robust plant growth, including agricultural plants.
With these facts in mind, let us look at the original questions.
Question 2: Does the cause precede the effect? In this case, what we should see, when we look at the historical record, is that the cause (increase in CO2) precedes the effect (increase in temperature). So what does a graph of the actual data look like? See Figure 1 below.
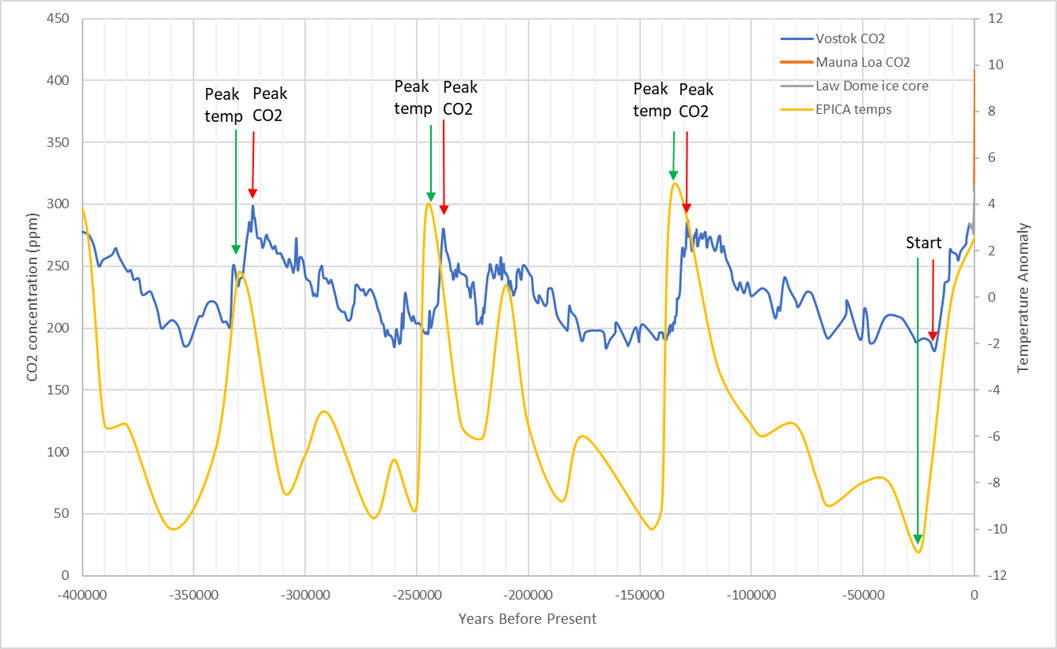
What is clearly visible is that the temperature increase precedes the CO2 increase—exactly the opposite of the theoretical prediction. What is happening is that when global temperatures increase, it leads to ocean temperatures increasing, and as you probably learned in chemistry class, gasses are less soluble at higher temperatures (that’s why you see bubbles when you boil water), so as the ocean temperatures increase, CO2 is released.
OK, now let’s look at the next question. 3: What does the historical record show? What we would expect to see is that in the past, before modern industrial times, global temperatures should be fairly steady, only increasing when industry and industrial products such as cars began spewing large amounts of CO2. So what is the historical record? See Figure 2 below.
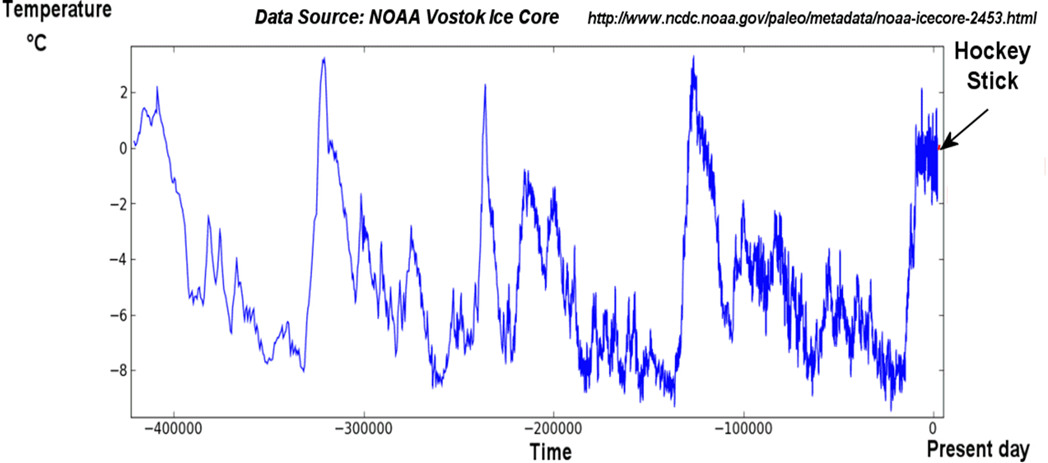
It looks like we have a problem: there have been large periodic temperature swings, obviously unrelated to human activity. If you look closely, you can see that the peak temperature periods tend to be rather short, followed by long periods of colder global temperatures. At present, we are at or near a peak in temperature. We may in fact be overdue for a change, though the time scale for that would be on the order of thousands of years. Clearly there are powerful cyclical phenomena involved in the Earth’s climate, over which we have no control.
We can go back further to look at temperature and CO2. See Figure 3 below.
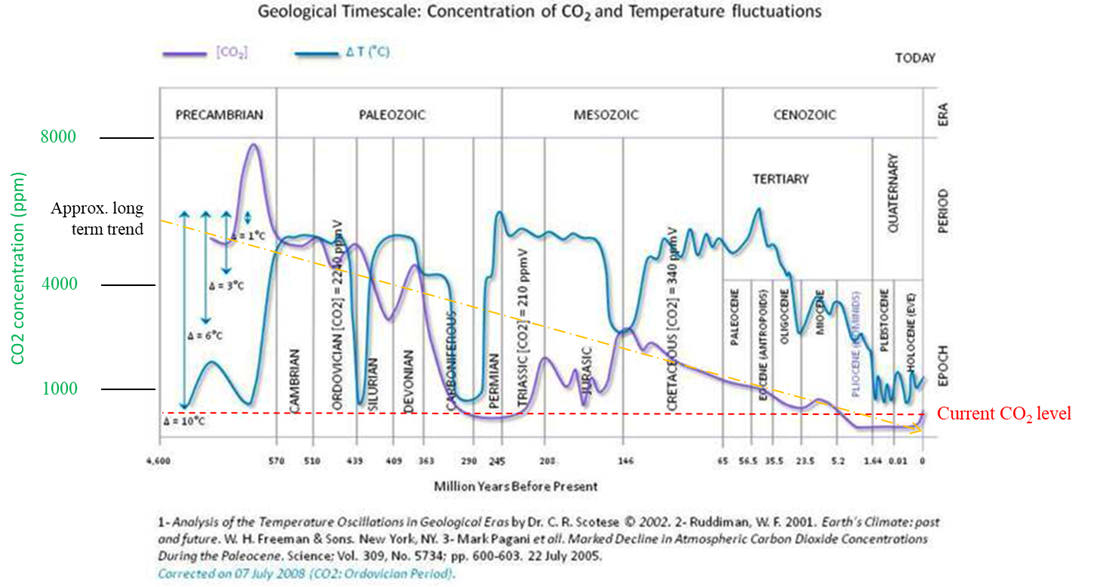
We would expect at least some general correlation between these two. But even a casual glance at this graph shows that there is no real correlation between CO2 and temperature. Observe that current CO2 levels are at or below anything seen in the past 250 million years. Likewise, temperatures are lower than during most of Earth’s history. During the Triassic and Jurassic periods, when both CO2 and temperature were noticeably higher than at present, life flourished (just ask the dinosaurs), as it did earlier, in the Carboniferous period (about 350 million years ago) when most of our coal beds and oil reservoirs were laid down by the abundant vegetation.
Now we turn to question 4: What specific predictions does the theory make? There have been many, but fortunately someone has catalogued them and put the resulting table on the Internet. You can view it at your leisure: www.extinctionclock.org. The table includes the date of each prediction, what the prediction asserts, and the date when the prediction is supposed to come true. The top half of the table covers predictions still ongoing; the bottom half (much longer) includes predictions made that failed to come true. Notably, not a single prediction has been borne out. To disguise this inconvenient fact, proponents of the theory (including NASA) have been caught manipulating data to make it look like more warming has occurred recently than what the unaltered data show. Nowadays, however, it isn’t possible to get away with this because of the Way Back machine for the Internet and various printed records, that show the unaltered data.
Other considerations
The theory fails on all three critical questions. But maybe in the immediate past it has some validity. The problem, of course, is that with processes that have time constants on the order of tens of thousands of years, it is very difficult to gauge trends based on a few decades of data, the same as looking for stock market trends based on a few minutes of trading. Nonetheless, let’s look at data closer to home, going back just 4,000 years (a mere blip in the record): See Figure 4 below.
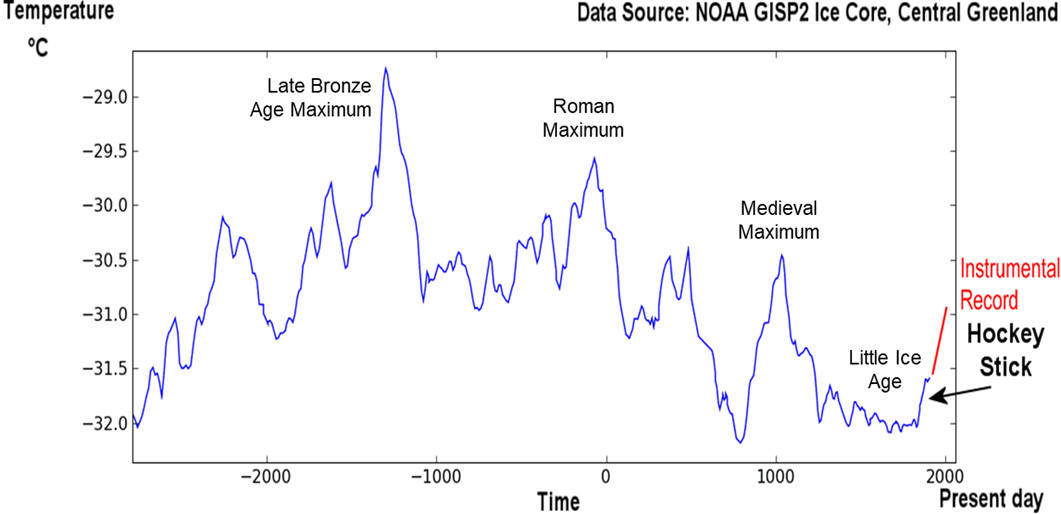
As you can see, there were much warmer periods in the past, specifically at the end of the Bronze Age, during the peak of the Roman Empire, and during the Medieval Period. We know that in the Roman Period, wine grapes were grown in Britain, something not possible now. Likewise, we know that during the Medieval Period, weather was much milder, followed later by the Little Ice Age, which caused very cold winters in much of Europe (well documented in paintings from the time). The Little Ice Age slowly wound down, continuing into the late 19th century.
OK, how about a little closer to the present time? See Figure 5 below.
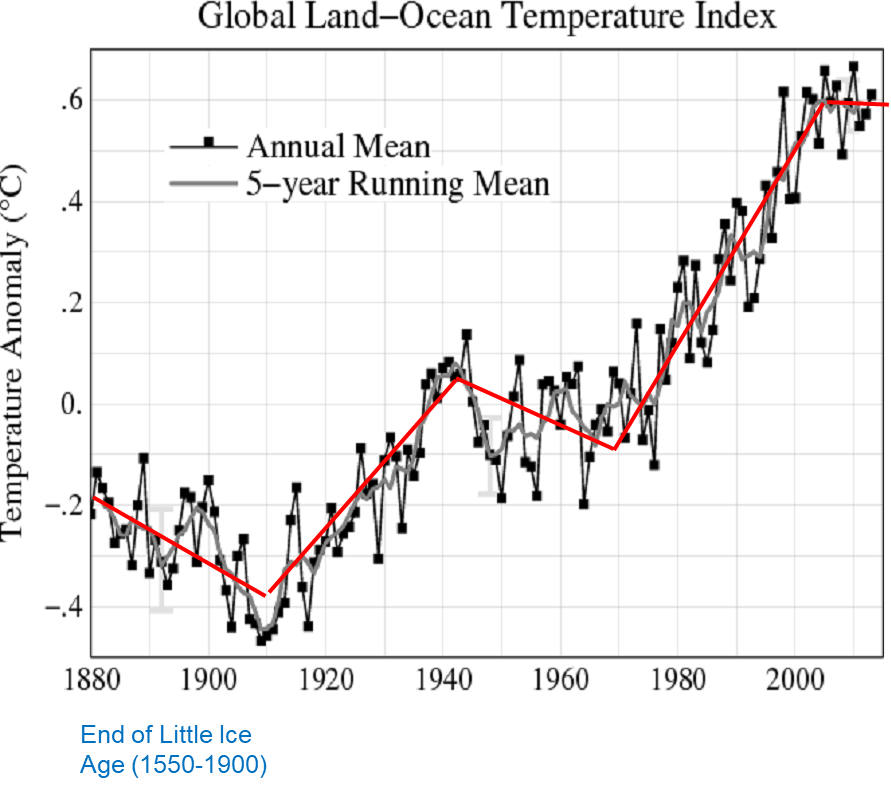
What this figure shows is five broad periods. First, from about 1880 to 1910, there was a drop in temperature, followed by a rise between 1910 and 1945. This included the well-known “Dust Bowl” period in the US during the 1930s. The peak, around the end of 1945, caused some problems for the Allies in World War II, and during this period the Arctic was close to ice-free. That was followed by a drop between 1945 and 1970, when there were widespread predictions of a new Ice Age dawning. The sharp rise between 1970 and around 2005 is what triggered the current hysteria about global warming, including the impending doom of humanity. However, this was followed by about a 20 year period of stable temperature. Not shown on this graph is the sharp peak in temperature of 2023, associated with an El Nino phenomenon.
It is important to bear in mind that computer-based climate models predict relatively small amounts of warming over long periods. Typically the change is estimated at around 2° C or about 3.6° F per century. This amounts to a barely discernible 0.02° C change per year. Any sharp movement in excess of that must be due to random weather patterns. We will need more years of data to confirm any trends. At present, computer models have not proved to be particularly reliable, and the effects of clouds and possible changes in solar radiation levels are very difficult to gauge.
Conclusion
Unfortunately, the whole climate change discussion has been irredeemably politicized, so only evidence for global warming is ever allowed to be discussed in mainstream media and scientific journals. The following cautionary tale referring to the situation around 1300 AD may help to keep things in perspective:
For five centuries, Europe basked in warm, settled weather, with only the occasional bitter winters, cool summers, and memorable storms, like the cold year of 1258 caused by a distant volcanic eruption…. Summer after summer passed with long, dreamy days, golden sunlight, and bountiful harvests. Compared with what was to follow, these centuries were a climatic golden age…. Nothing prepared [the Europeans] for the catastrophe ahead. [B. Fagan, The Little Ice Age, Basic Books, 2000, p. 21]
The catastrophe referred to was the Little Ice Age, ushered in by the unprecedented cold and rain of 1315, which caused widespread crop failures and famine, and is believed to be responsible for a weakened populace in the face of the Black Death plague that came 25 years later. This shows that significant changes in temperature can occur over relatively short periods (multiple decades), superimposed on longer trends.
In conclusion, we can say that the theory of anthropogenic warming is based on rather long-range extrapolation from a data set much shorter than known climate cycles. The basic assumption of the theory is very problematic and not reflected in the historical record. The theory has been unable to make reliable predictions. It is therefore unclear whether human activity is having a significant impact on climate, or whether proposed actions (such as switching everyone to electric vehicles) will change the course of global temperatures.

Thomas Fowler Sc.D. has been analyzing data and programs for 50 years, serving as a consultant to government agencies. He has also been a professor of mathematics, physics, and engineering, and is the author of four books and 145 articles, several dealing with the climate change issue. He is especially concerned about the increasing polticization of science and engineering, and its effect on student education and the ability of elected officials to make accurate judgments. See full bio.
All comments are moderated. To lighten our editing burden, only current donors are allowed to Sound Off. If you are a current donor, log in to see the comment form; otherwise please support our work, and Sound Off!

-
Posted by: Randal Mandock -
May. 22, 2024 12:15 AM ET USA
In 2013 I was appointed to a "sustainability" committee at my university. I asked myself what a geophysicist with a specialization in atmospheric science could contribute to such a committee. I had been ignoring the global warming hysteria for 3 decades because it is a political, not scientific, issue. I decided to do a harmonic analysis to look for naturally occurring cycles in the century-and-a-half long dataset. My results paralleled those of a German team: natural cycles can explain a lot.
-
Posted by: james-w-anderson8230 -
May. 21, 2024 11:11 PM ET USA
Thanks for this very informative article. It was just what I was looking for to correct Pope Francis' uninformed comments on global warming caused by greedy men.
-
Posted by: miketimmer499385 -
May. 21, 2024 1:49 PM ET USA
Thanks for being so bold as to publish this in the face of almost certain abuse coming your way from any number of sources.